- Coiled Spring Capital Macro Report
- Posts
- Coiled Spring Capital MR 7/27/25
Coiled Spring Capital MR 7/27/25
Pivotal Week! - This Week's Analysis
Table of Contents
Introduction
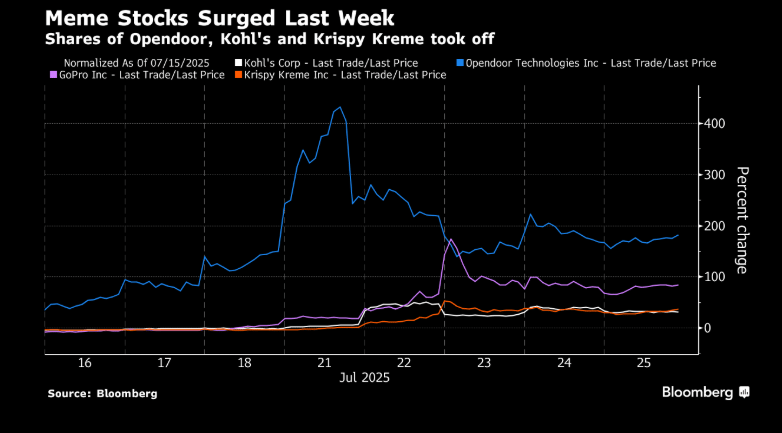
The media’s obsession with the Meme stock resurgence has reached a fever pitch. Everywhere you look, headlines warn of speculative excess, retail-driven froth, option mania, and short squeezes—culminating in dire forecasts for the broader market. The narrative is practically on autopilot: "Here comes the crash."
Curious to quantify the hysteria, we ran a simple AI query comparing major articles on Meme stocks to those highlighting positive developments in the U.S. economy. The results didn’t shock us—Meme stock stories outnumbered positive economic coverage by more than 2 to 1.
Why? Because doom sells. Fear drives clicks. And paradoxically, that persistent wall of worry—amplified by media cynicism—is one of the strongest tailwinds for this market. Markets climb not on consensus, but on skepticism. As long as controversy trumps confidence, the rally still has fuel.
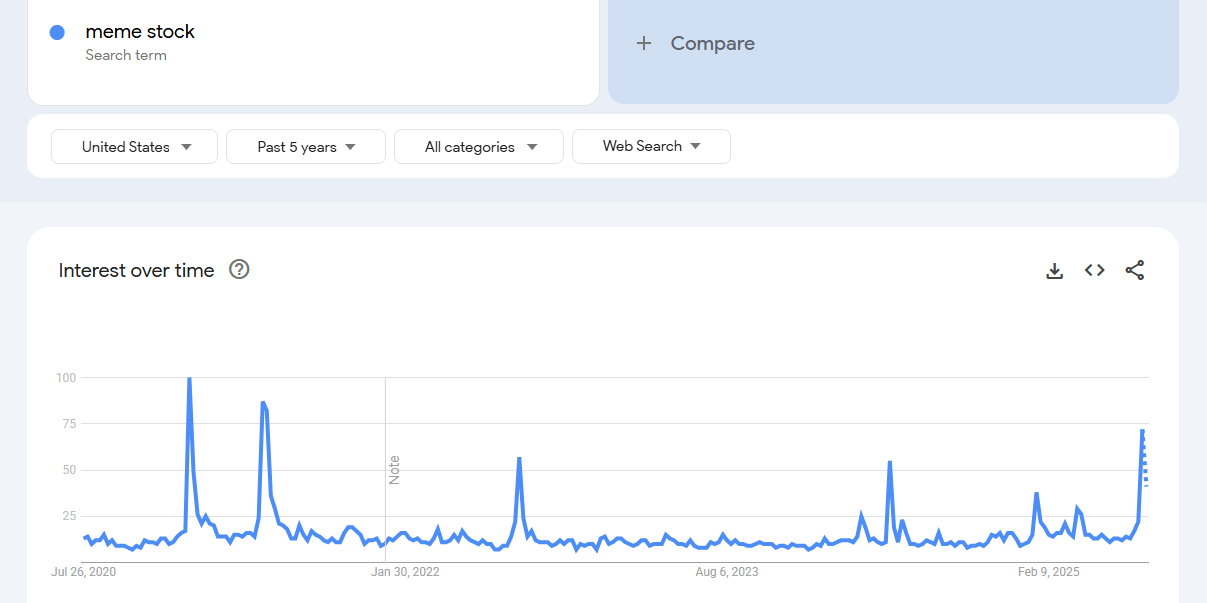
It should come as no surprise that Google search trends for “Meme Stocks” have surged back to their highest levels since the height of the mania in 2021—a clear reflection of just how captivated the public is by this speculative resurgence.
In our 7/23 report, Silly Season is Back, we presented a straightforward analysis comparing the timeline between the peak of the original meme stock craze ($GME) and the eventual peak in the SPX. The lag was meaningful, underscoring a critical point: while speculative activity may mark the later stages of a rally, it often persists far longer—and pushes far higher—than most anticipate. In short, meme stock enthusiasm is not a reliable timing tool for calling market tops.
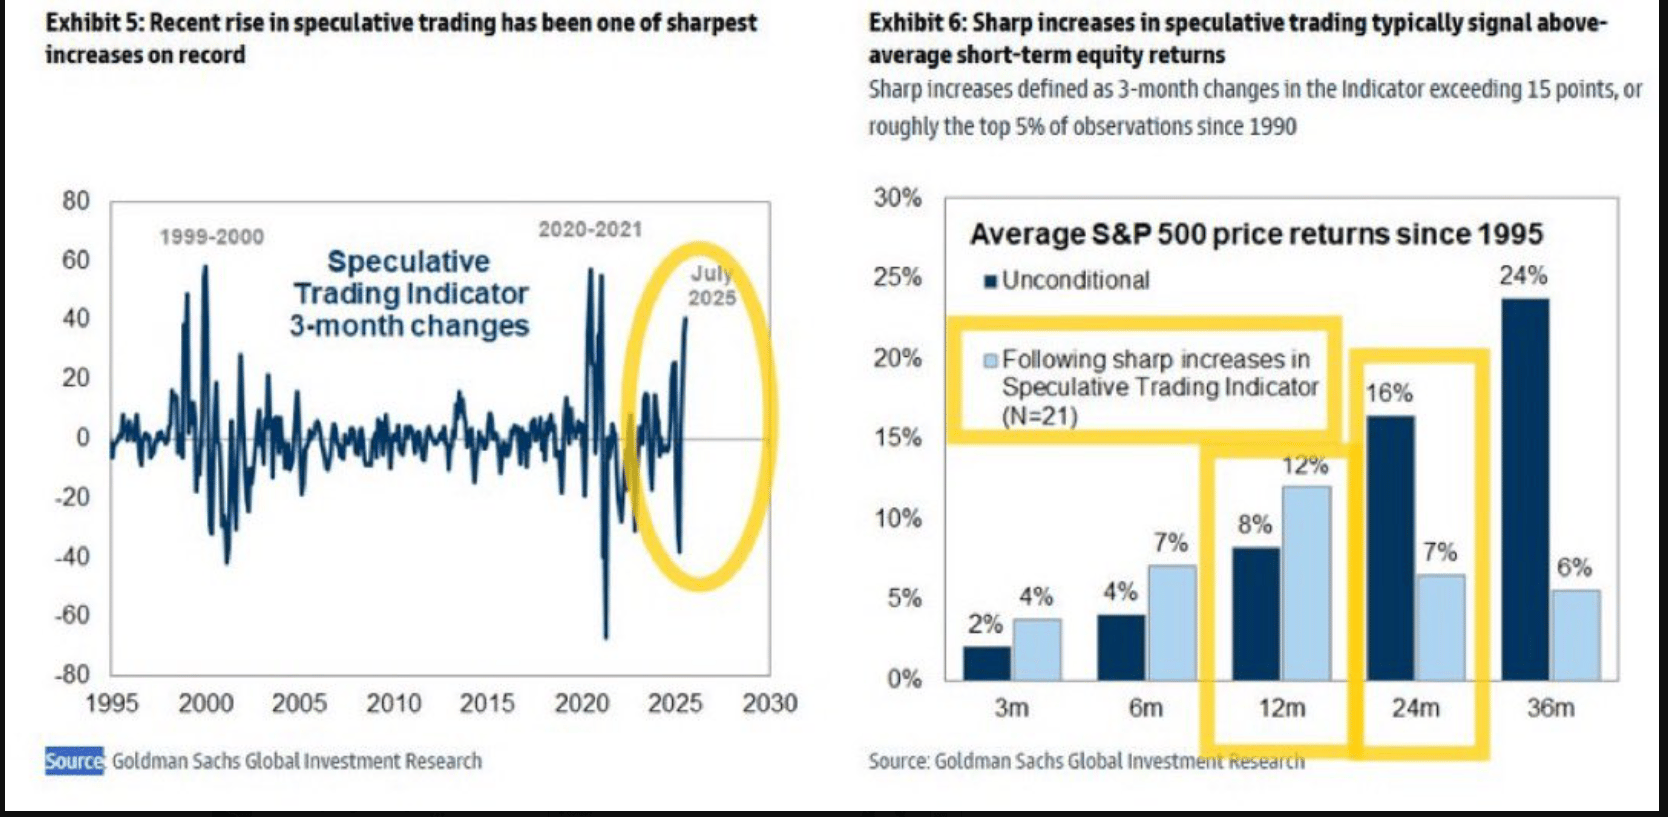
Supporting this view, the chart below from Goldman Sachs echoes a similar conclusion: heightened speculative behavior is typically associated with above-average short- and intermediate-term equity returns, especially over the following 12 months.
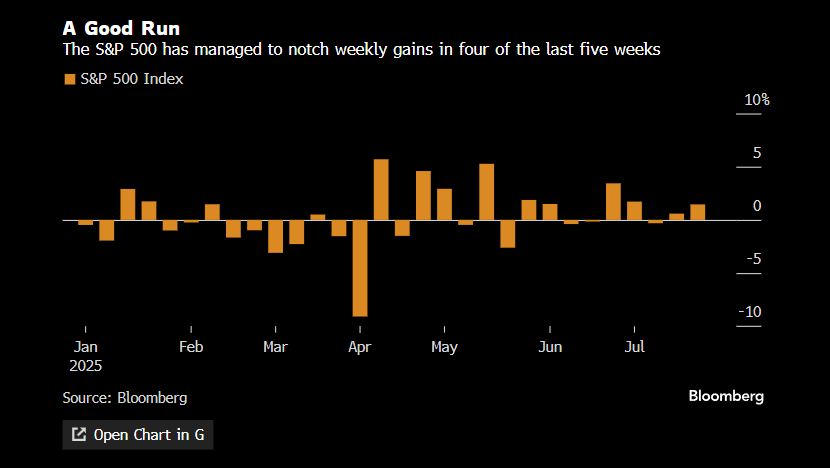
The U.S. stock market indexes continue their steady ascent, underpinned by renewed trade deal momentum—China’s agreement was extended another 90 days, and a breakthrough with Europe appears to be in place—while the domestic economy remains surprisingly resilient.
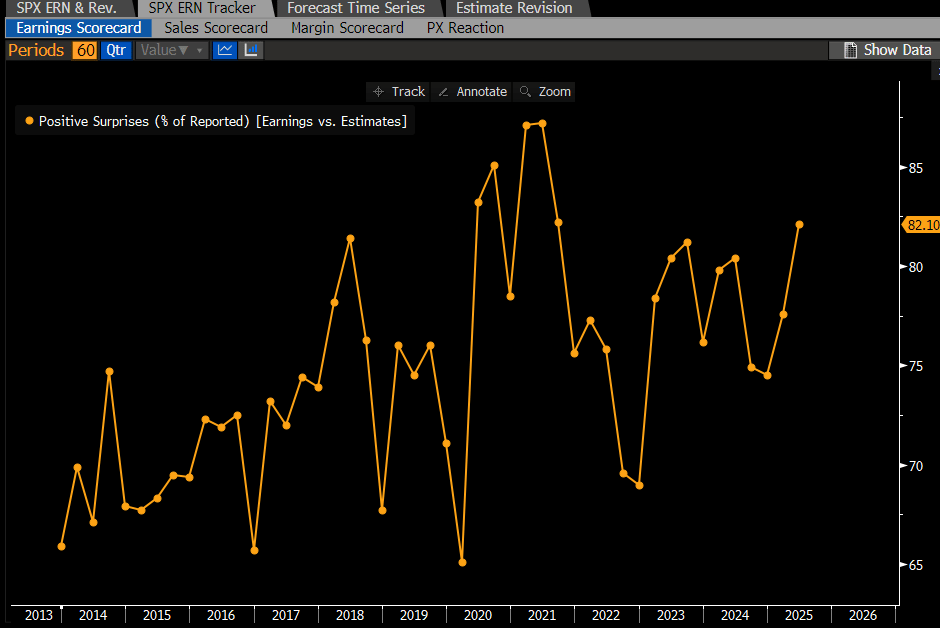
The first wave of earnings reports has been undeniably strong—something we anticipated would not derail the market’s current trajectory. So far, an impressive 82% of companies have beaten expectations. Excluding the extraordinary 2020–2021 pandemic period, this marks the highest beat rate in over a decade—hardly the kind of backdrop that signals a looming recession.
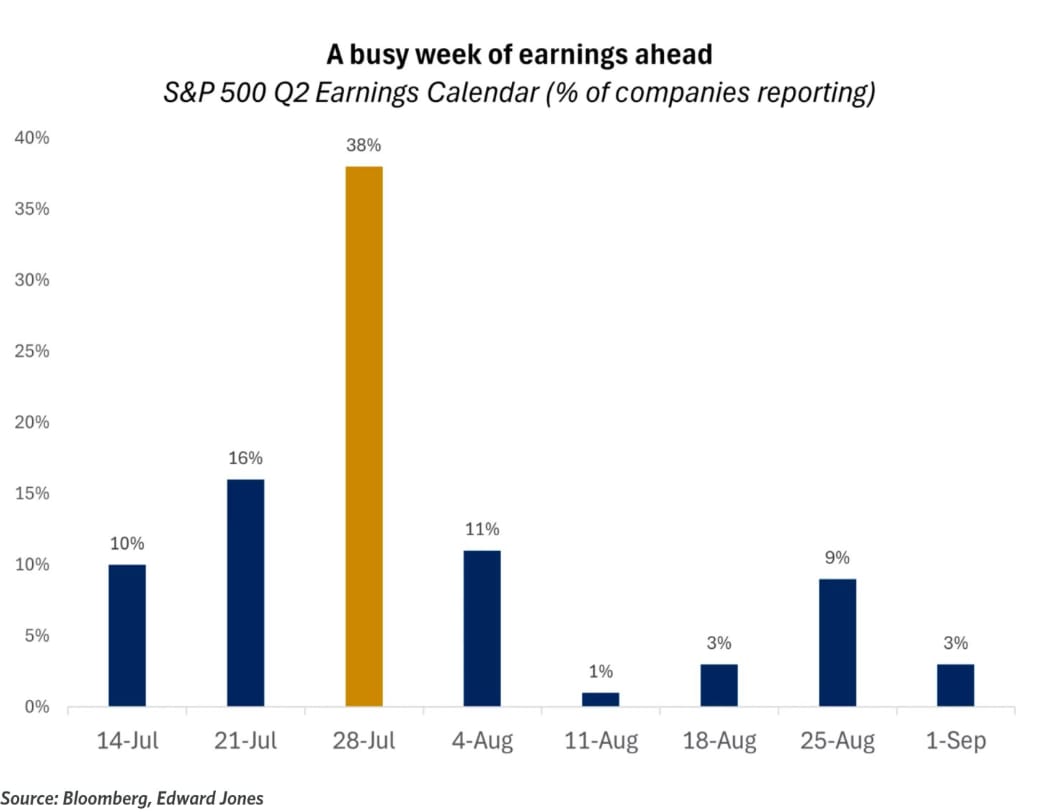
The week ahead is set to be a defining one for the rest of August. Not only does it mark the busiest stretch of the earnings season—with 38% of S&P 500 companies reporting—but it also brings a trio of key macro events: the FOMC interest rate decision on Wednesday, the PCE inflation report on Thursday, and a pivotal jobs report on Friday.
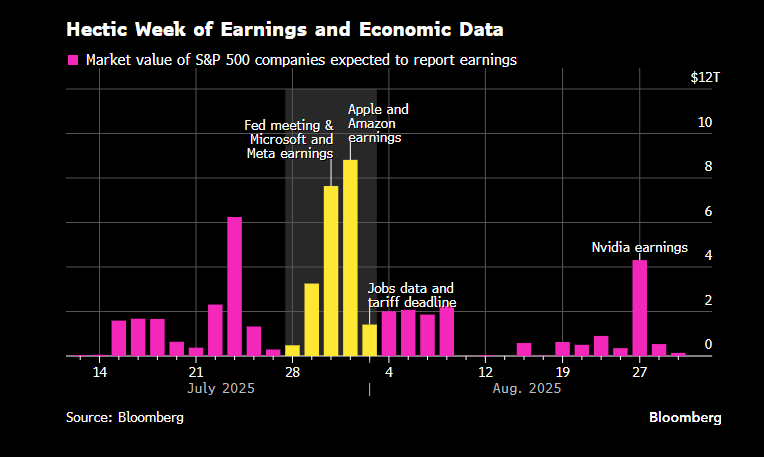
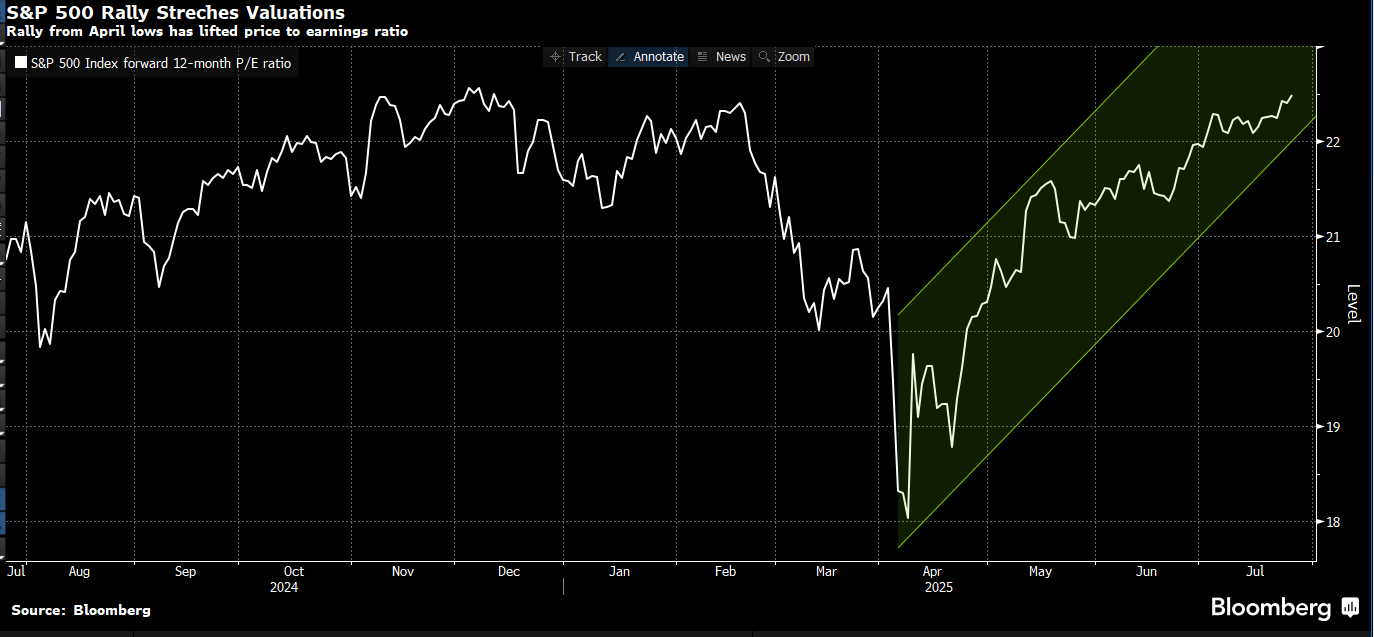
The stock market remains richly valued, leaving little margin for error from companies issuing forward guidance. Any upside surprise in the PCE inflation report or a weak employment reading could quickly dampen risk appetite.
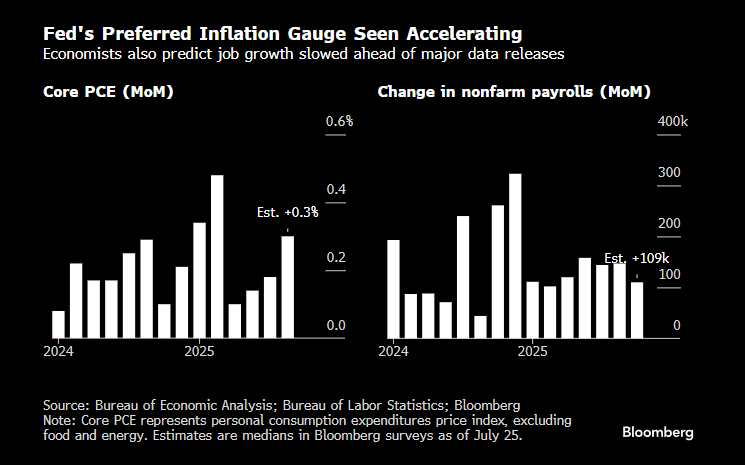
The market has priced in a significant amount of good news, leaving little room for disappointment. Any deviation from expectations could trigger heightened volatility.
Interestingly, the options market appears to be bracing for potential turbulence, with the put/call ratio spiking last week. While not extreme when viewed through the lens of its Z-score (see bottom panel), the reading is notably elevated. This uptick in the ratio reflects growing concern and likely points to increased hedging activity under the surface.
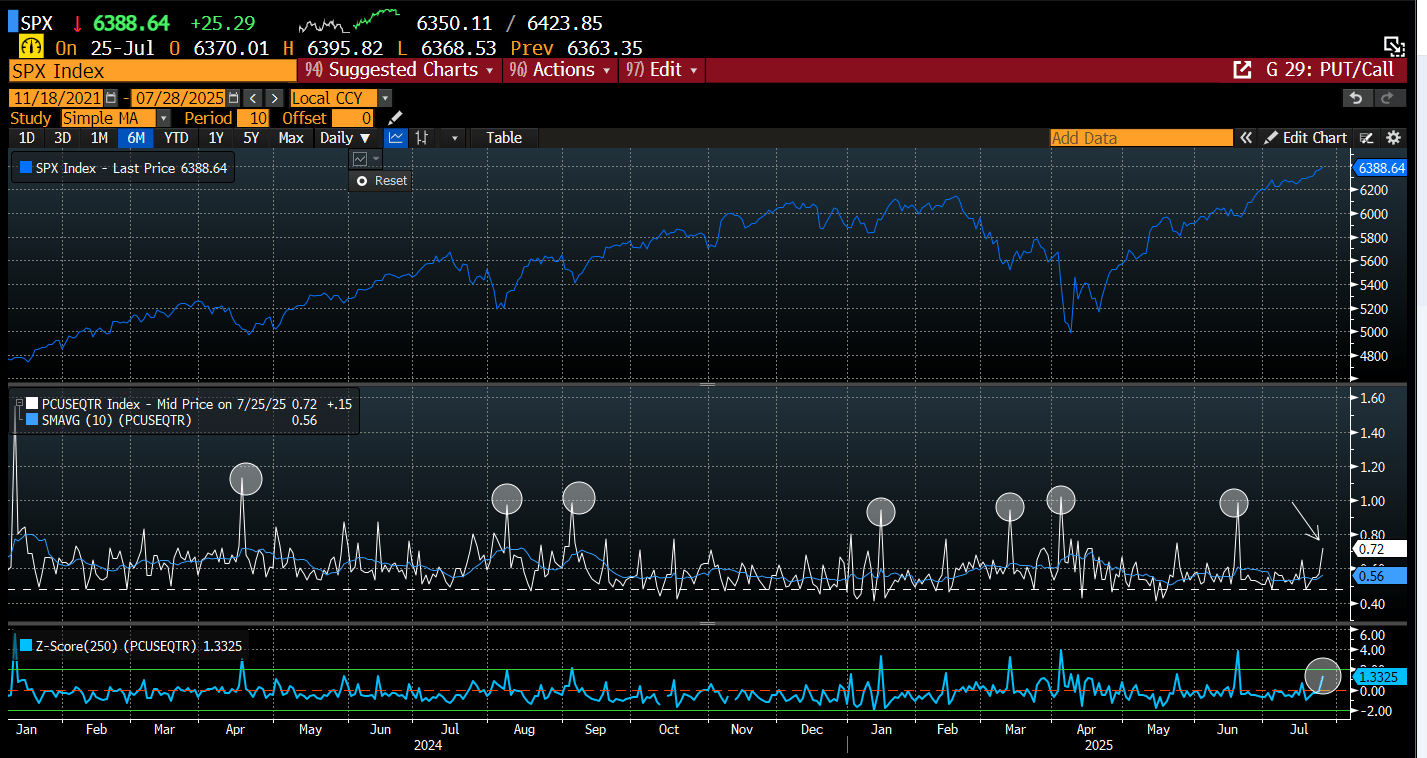
Are professional investors positioning ahead of what could be a disappointing week and potential index reversion, or are they simply hedging against macro uncertainty? It’s hard to know for sure. Historically, however, elevated hedging that doesn’t materialize into downside risk often leads to a post-event unwind—fueling higher equity prices.
We don’t claim to have foresight into how this week’s macro events will unfold—we’re simply presenting the setup as it stands.
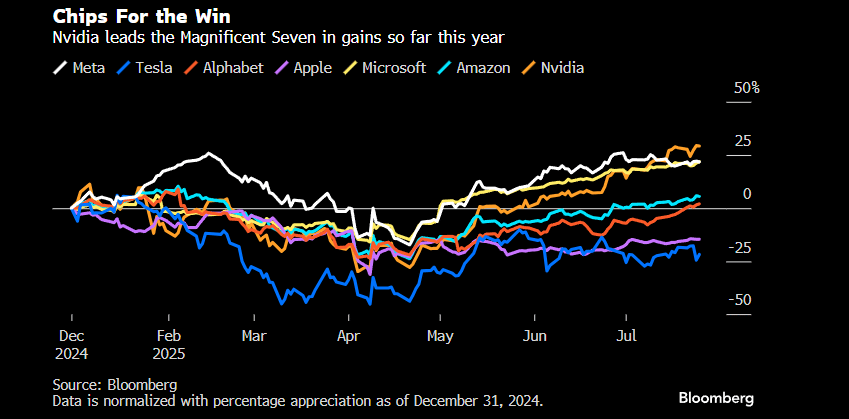
One final point worth highlighting: NVDA is currently leading the Mag 7 in YTD performance. This matters. Historically, when NVDA leads, the broader index tends to follow.
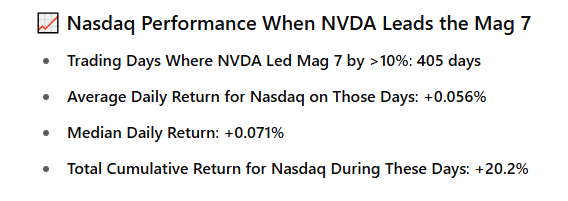
A simple 5-year study of NVDA’s leadership relative to the Nasdaq reveals a compelling relationship: when NVDA leads, the index tends to follow. The data below speaks for itself.
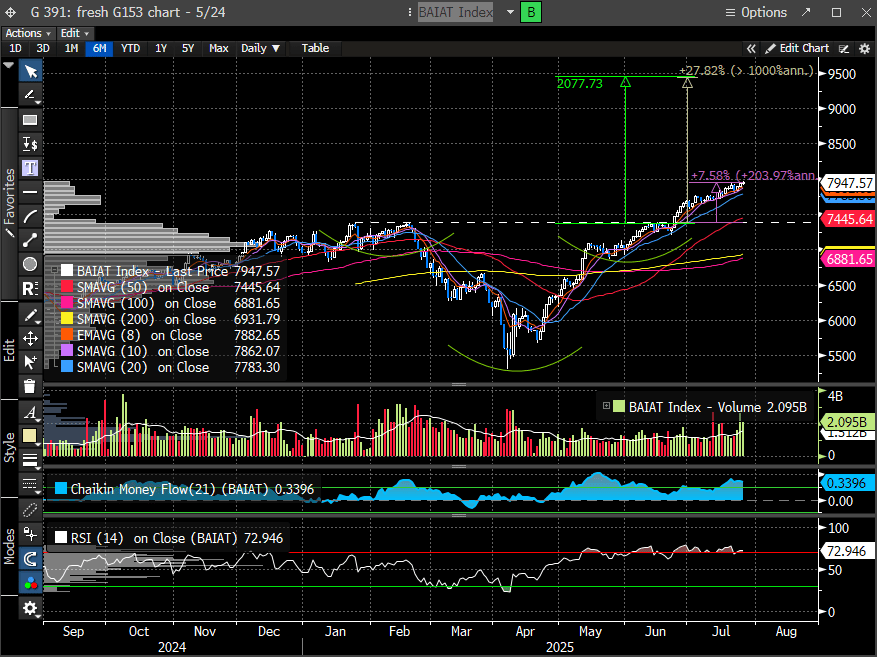
Intuitively, this relationship makes sense—NVDA sits at the center of the AI ecosystem, and as it scales and Hyperscaler’s ramp up spending, the ripple effect benefits a wide range of companies. The Bloomberg AI Index reflects this dynamic. Stripping out opinions and focusing strictly on the technical setup, the inverse head and shoulders breakout from June projects a measured move that’s 27% above the breakout level. That suggests the recent rally is only about a quarter of the way through. While markets never move in a straight line, this offers a useful framework for gauging the potential runway still ahead for growth stocks.
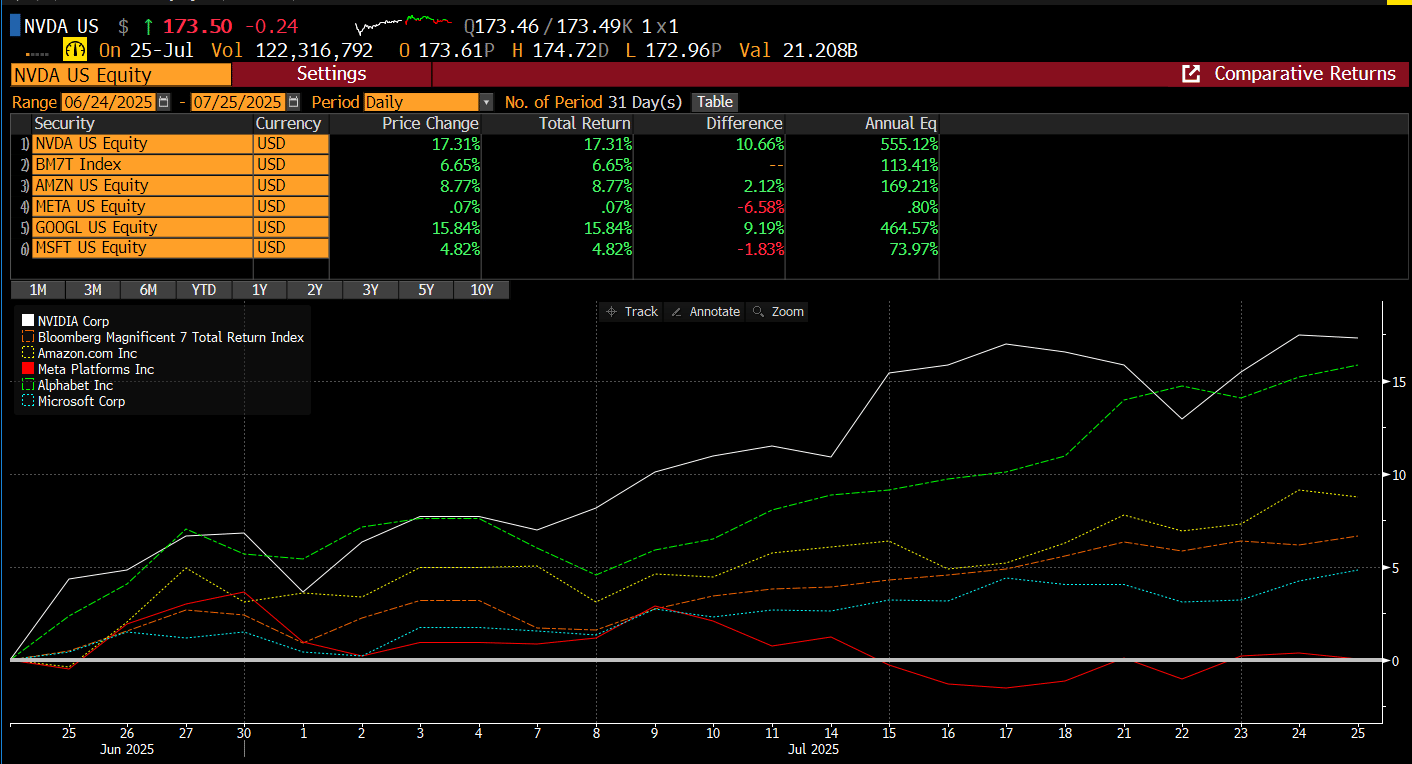
Since the AI basket broke resistance on June 24th, NVDA has outperformed the Mag 7 Index (BM7T Index) by more than 1000 basis points—cementing its leadership role in the AI-driven rally.
Does this guarantee the stock market is headed higher? Absolutely not. But we deal in probabilities—not certainties—and the weight of evidence continues to tilt in one direction: up. That said, markets never move in straight lines, and as we’ve highlighted in recent reports, conditions remain in place for a potential short-term peak.
Let’s dive in.
